A much anticipated Federal Reserve “Fed” meeting will be taking place over the course of Tuesday and Wednesday this week. The anticipation can be summed up in one word, “patient” which refers to whether the Fed will maintain its patience on increasing short term rates or whether it will set the stage for a rate hike later this year. Stagnant inflation continues to be the primary reason the Fed should wait to raise rates. Plunging oil prices since June of last year helped send a key gauge of inflation well below where the Fed would like to be at in order to set the stage for a rate hike. Regardless of the outcome of the meeting, investors and consumers need to know what to be aware of in the event of a rate hike so they can position their portfolio and financial house accordingly.
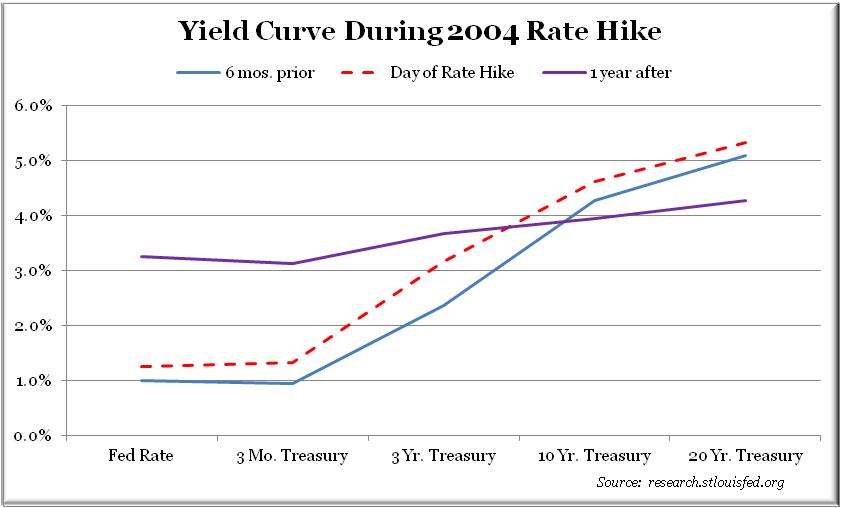
When most people hear that the Fed is going to raise rates, they immediately assume rates on loans such as mortgages will increase. The rate the Fed actually controls is the shortest term interest rate, the overnight lending rate for financial institutions, currently in a range of 0 – .25%. Rates such as a 30-year mortgage are considered a long term rate. When illustrating short and long term rates it is often useful to refer to what is called the yield curve. The yield curve depicts interest rates, at a set point in time, of bonds that have an equal credit quality, but differing maturity dates (payback lengths). The last time the Fed took initial action to increase short term interest rates was in 2004. The chart below shows the yield curve 6 months prior, the day of and 1 year after the Fed’s initial rate hike. You can see that even though the short end of the curve (Fed rate/overnight lending rate) increased from 1% to 3.25%, the long end of the curve actually declined. This is typically referred to as a flattening of the yield curve.
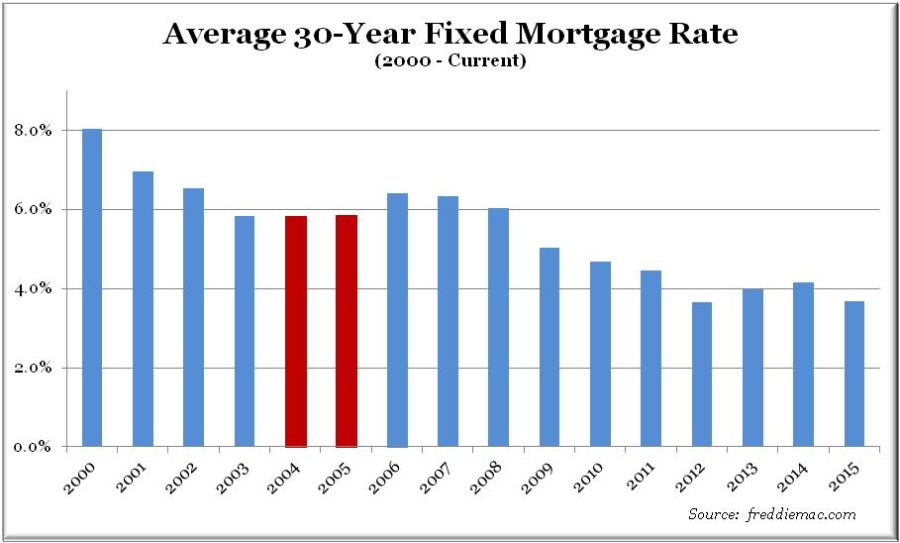
The average rate on a 30-year mortgage rate was virtually unchanged from 2004 to 2005. Over this same time frame, the Fed raised rates 13 times from 1% to 4.25%.
Since January of 2003, the highest level the real rate of the 10-year treasury bond has achieved is 2.89% (1). Simply put, the real rate of interest is the nominal interest rate minus the annual inflation rate. For example, say you make a loan to a friend at 5%, the nominal interest rate is the 5% and if we assume a 1.5% annual inflation rate the real rate would be 3.5% (5% minus 1.5%). The 3.5% you’re left with is the actual return on your investment that can be used to purchase another investment, or the purchasing power. If we assume a 1.5% inflation rate, then the maximum rate the 10-year note could rise to before surpassing the high since 2003 is 4.39%. If inflation does meet the Feds target of 2% the max the 10-year could go to is 4.89%. This large a move seems highly unlikely with commodity prices back to 2010 levels and oil prices remaining suppressed around $50 a barrel.
According to the Fed’s website, one of the primary roles of the Fed is, “Conducting the nation’s monetary policy by influencing money and credit conditions in the economy in pursuit of full employment and stable prices.” (2) Monetary policy has worked very well to bring the unemployment rate from the highest level since the Great Depression to near full employment levels today. The bigger challenge for the Fed has been the pursuit to maintain stable prices. According to the Commerce Department, the price index for personal consumption expenditures, which the Fed follows very closely when determining price stability, rose only 0.2% in January from a year earlier. This is on the heels of annual growth of 0.8% in December, 1.2% in November and 1.4% in October. (3) These readings are well below the Fed’s target for this rate of 2%.
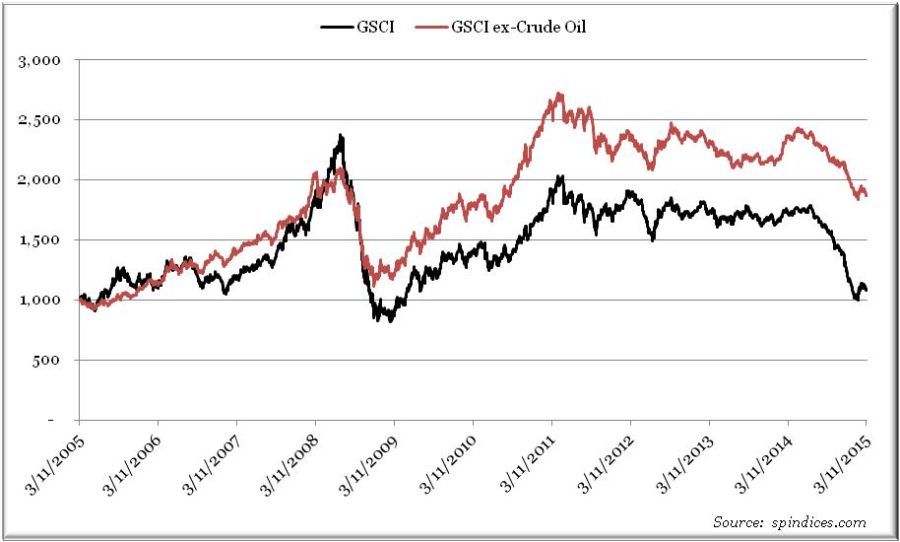
Commodity prices are a good indicator for where inflation is and where it may be going. The Goldman Sachs Commodity Index (GSCI) is a highly tracked index for commodity prices. The GSCI index is comprised of five commodity sectors including: energy, industrial materials, precious metals, agriculture and livestock. The target weightings of each sector vary with the highest weight towards energy, primarily oil. You can see from the chart that we are near 2005 levels, which is largely due to the recent selloff in oil. If you look at the GSCI ex-Oil, which excludes crude oil from the index, we are back to middle of 2010 levels. Inflation will continue to remain subdued without some form of monetary stimulus, a recovery in oil prices or a significant spike in economic growth.
Global demand for U.S. treasury securities has been increasing each day as the dollar continues to power higher and as the relative yields on U.S. treasuries compared to global bond yields continues to look attractive. Both emerging and developed countries across the globe are easing their monetary policies with 24 central banks cutting their rates this year alone. (4) When we determine the likelihood of the Fed making its move increases, we will be keeping an eye on real U.S. treasury rates as an indicator to the direction of the yield curve. If the Fed does not move now and highlights a lack of inflation for continued patience, then all eyes will return to oil and inflation prospects for market direction.
If you want to see how much information is digested after a Fed statement is released, just follow the rate on the 10-year note around 12PM MST on Wednesday and see how much it moves. After each Fed meeting, much is made of specific words that appear in the Fed’s statement. How many times did a word appear? Is there a keyword that was used in prior statements and is no longer in the current statement? Currently, one of those keywords that many investors are following is the word “patient” when referring to when the Fed will return to a more normal monetary policy. If the Fed drops the word patient from their statement this week, you can be sure that the market will react and the likelihood of a rate hike within the year will increase significantly.
Luke Nagell
Investment Committee Member
Sources:
(1) Multpl.com
(2) http://www.federalreserve.gov/faqs/about_12594.htm
(3) http://www.bls.gov/news.release/pdf/cpi.pdf
(4) http://www.cnbc.com/id/102499561
Opinions expressed are not meant to provide legal, tax, or other professional advice or recommendations. All information has been prepared solely for informational purposes, and is not an offer to buy or sell, or a solicitation of an offer to buy or sell, any securities or instrument or to participate in any particular trading strategy. Investing involves risk, including the possible loss of principal. All opinions and views constitute our judgment as of the date of writing and are subject to change at any time without notice. Investors should consider the investment objectives, risks, charges and expenses of the underlying funds that make up the model portfolios carefully before investing. The ADV Part II document should be read carefully before investing. Please contact a licensed advisor working with Weatherstone to obtain a current copy. If the reader has any question regarding suitability or applicability of any specific issue discussed above, he/she is encouraged to consult with their licensed investment professional. Weatherstone Capital Management is an SEC Registered Investment Advisor with the U.S. Securities and Exchange Commission (SEC) under the Investment Advisers Act of 1940. Weatherstone Capital Management is not affiliated with any broker/dealer, and works with several broker/dealers to distribute its products and services. Past performance does not guarantee future results.


