- In an election year, if the S&P 500 Index ended the month of January higher, the index ended the year in positive territory eight out of eight times. January ended the month up 4.4%.
- Since WWII, Ronald Reagan is the only president to be re-elected with the unemployment rate above 6%. The current unemployment rate is 8.3%
- The effects of the length of time and the size of the job losses will continue well after each job has been replaced.
The presidential election is traditionally held on the Tuesday after the first Monday in November. Holding the election on the Tuesday after the first Monday of the month assured that the election would never be held on the first day of the month. This was preferred since many business owners completed their books on the first day of the month and a poor business month could affect the vote of the business owner (1). The economy has always been one of the main focal points of voting. Whether it’s positive or negative, the economy is the one issue that affects every individual. Who doesn’t remember the famous quote by President Bill Clinton, “It’s the economy, stupid.” The U.S. is still feeling aftershocks from the great recession of 2008 and the economy will undoubtedly take center stage in the 2012 election.
To find another election year with a similar economic backdrop, you need to go back to the election of 1984 between the Republican incumbent, Ronald Reagan and the Democratic opponent, Walter Mondale. The biggest parallels between these two elections are an incumbent running for re-election and the unemployment rate and job growth leading up to the election. Since WWII, only one president, Ronald Reagan, has been re-elected with an unemployment rate above 6 percent. President Reagan was re-elected in 1984 with an unemployment rate of 7.2 percent, however, the unemployment rate had declined 3 percentage points in the previous 18 months (2). Reagan won in a landslide with 54.5 million popular votes compared to only 37.6 million for his Democratic opponent, Walter Mondale. In addition, Reagan received 525 electoral votes. Both the number of popular votes and the number of electoral votes are the highest in the history of presidential elections (3).
The December 2011 labor report was better than expected and the year ended with adding 1.64 million jobs, the most since 2006 (2). In addition, payrolls in January increased 243,000, well above the consensus estimate. However, even at December’s and January’s pace of job gains, it would still take 2.5 years to get the unemployment level back to a pre-recession level. The chart below shows a comparison of the unemployment level of the 24 months leading up to the election in 1984 and the most recent 15 months of unemployment data. The projected unemployment rate data for 2012 is based on the trailing 12 month average monthly job gain/loss. In light of this month’s commentary topic, I thought it was fitting to use red and blue colors for the charts.
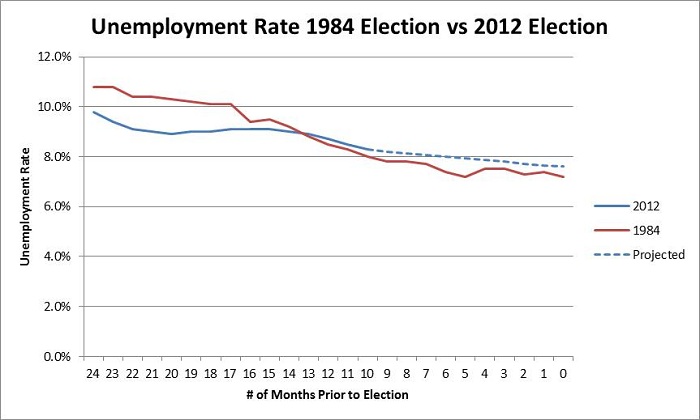
Data for chart retrieved from the Bureau of Labor Statistics (4)
When comparing other areas of the economy, many areas are so far from being in line that you would wonder how you can compare the two periods. The average inflation rate during 1984 was 4.3% while we are currently below 2% (5). To combat the high inflation, interest rates were at an elevated level throughout 1984 with the average 10-year treasury yield at 12.46% (6). Currently, the 10-year treasury is hovering around 2%. Another very crucial issue heading into this election will be the current and forecasted level of the U.S. budget deficit. Around election time in 1984, the debt-to-GDP ratio was near 34%. Once 4th quarter GDP is released for 2011, the debt-to-GDP ratio is expected to exceed 100%. The stock markets are off to a good start for 2012 and based on election year data, this indicator points towards a higher close for 2012.
Since 1950, during an election year if the S&P 500 index ended January in positive territory, it ended the year positive. This has occurred eight out eight times, each year is indicated in the chart below with an asterisk next to the year. The S&P 500 ended January, 2012 with a 4.4% gain. Out of the eight times January ended the month higher for an election year, January’s 2012 was the 3rd highest recording.
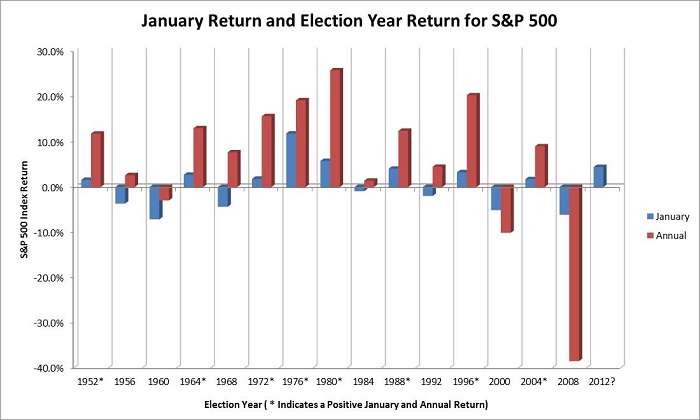
Data for chart retrieved from finance.yahoo.com (7)
Unemployment will continue to be a focal point for investors and voters in 2012. The effects of the length of time and the size of the job losses will continue well after each job has been replaced. Many will need to polish the job skills they acquired over the years and some will need training as they enter into new industries. The January election year barometer reading is pointing towards a higher close for stock markets in 2012. However, many wild cards still remain including a European debt crisis, slow global economic growth and a US budget deficit that will continue to loom over markets well into late 2012.
Luke Nagell
Investment Committee Member
Sources:
- http:www.fec.gov/law.shtml
- www.businessweek.com/news/2012-01-08/obama-re-election-odds-may-rise-as-unemployment-falls.html
- www.whitehouse.gov/about/presidents
- www.bls.gov
- www.multpl.com/
- http://research.stlouisfed.org/fred2/series/DGS10
- www.finance.yahoo.com
Discloure:
Opinions expressed are not meant to provide legal, tax, or other professional advice or recommendations. All opinions and views constitute our judgment as of the date of writing and are subject to change at any time without notice. Investors should consider the investment objectives, risks, charges and expenses of the underlying funds that make up the model portfolios carefully before investing. The ADV Part II document should be read carefully before investing. Weatherstone Capital Management is an SEC Registered Investment Advisor located in Denver, Colorado. Past performance does not guarantee future results.


