- While we know that rising interest rates lead to falling bond prices, it may not impact all bond and income-oriented asset classes equally
- In just a five month time-frame, the performance difference between high-yield corporate bonds and long-term treasury bonds was more than 6%
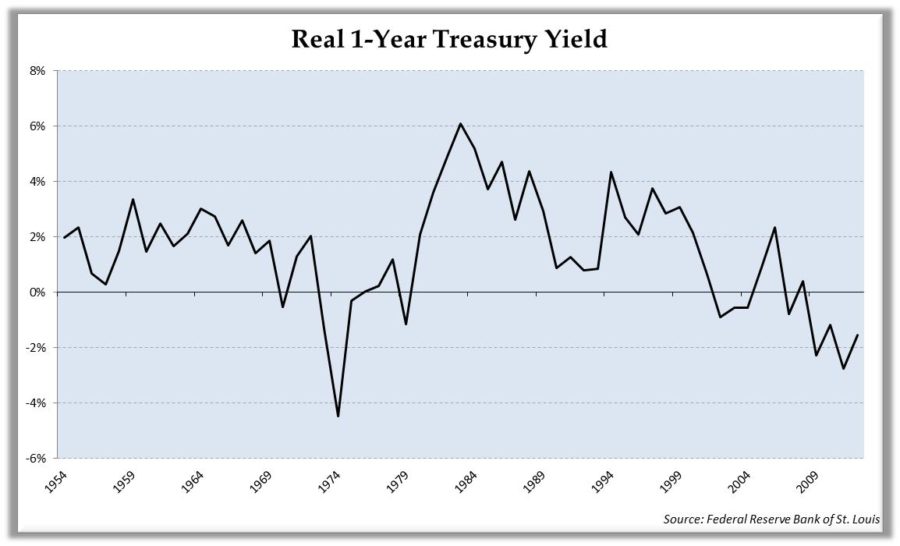
- Negative real interest rates are a clear sign that interest rates are being held below their normal levels
In the December commentary I discussed the challenges that we have in the current interest rate environment, namely that interest rates may stay low for an extended period of time similar to Japan over the past 20 years, or that we would see interest rates rise, which could push down the value of bonds, which is something that many investors have not seen in quite a while. Well, five months into the year bonds have been on a path of rising rates despite the Federal Reserve keeping the short-term interest rates that they directly control unchanged. Longer-term interest rates are based more upon the supply and demand by investors and with continued stability in the U.S. economy, and increasing signs of stabilization in Europe investors are directing less money to bonds at their current interest rate levels, causing bond prices to fall. As an example, consider the change in rates on U.S. Treasury Bonds of various maturities.
12/31/12 5/31/13 Change
30 Year 2.95% 3.30% +.35%
10 Year 1.78% 2.16% +.38%
7 Year 1.18% 1.55% +.37%
5 Year .72% 1.05% +.33%
3 Year .36% .52% +.16%
Source: Federal Reserve Bank of St. Louis
While we know that rising interest rates lead to falling bond prices, it may not impact all bond and income-oriented asset classes equally. As some segments are more sensitive to economic, bond maturity or equity market influences which can be seen as we look at the representative performance on some popular exchange-traded mutual funds that track some of these sectors:
Category Total Return through 5/31/13 Long-Term Treasury Bonds -4.73%
Intermediate-Term Treasury -1.51%
Treasury Inflation Protected Bonds -3.54%
Aggregate Bond -1.0%
High Yield Corporate Bond 1.62%
Bank Loan 2.36%
Preferred Stocks 3.42%
Utility Stocks 8.83%
Real Estate Stocks 8.39%
Source: NYSE Arca
As can be seen from the table above, in just a five month time-frame, the performance difference was significant, with over a 6% differential between high-yield corporate bonds and long-term treasury bonds as an example. In terms of what this has meant to the asset allocation in our income programs such as Managed Bond and Income Plus, the Managed Bond program has continued to primarily hold high-yield corporate bonds during much of this year, with a couple of time periods when rates were rising quickly enough that we needed to move the majority of the portfolio to cash in order to minimize the negative impact of rising rates. For the Income plus program, which has the highest level of flexibility of the two programs, allocations have also held predominantly high-yield bonds, in addition to a modest amount in utilities and real estate, and a small portion of the portfolio has alternated between inverse bond funds and treasuries. The added flexibility to utilize more asset classes has allowed it to be the better performing of the two programs over this time-frame.
As we look at where rates may go from here, we need to keep in mind that there are currently two very powerful forces at work. The first is that the weak economic recovery both in the United States and across many parts of the world is pressuring governments to cut interest rates and use non-traditional measures such as quantitative easing programs. These programs typically buy various types of bonds in an effort to drive interest rates even lower and provide additional stimulus for businesses to borrow. In addition, it forces investors to move money out of short-term “safe” investment areas such as money market funds and into equities and other more speculative areas of the financial markets. The primary goal is to increase asset prices and create a “wealth effect” that will further stimulate the economy as people spend some of the gains that they have made on their investments.
The second powerful force can be shown in the chart below which shows the return on 1-year U.S. treasury bonds when adjusted for inflation. It is clear that interest rates are being held below their normal levels relative to inflation by government policy. There is a strong likelihood that interest rates will need to rise to move back to more normal historical levels if and when economic activity returns to more normal levels. This increase in interest rates and the possibility that interest rates may move somewhat above historically normal levels due to fears that above-average inflation may result from the extensive amount of money injected into the economy as a result of the quantitative easing programs. While this concern is not on the immediate horizon, it is important to keep in mind the implications to bonds that such a shift may have because it may be the next chapter in the very unusual bond market environment that we have seen since 2007.
In summary, it is important to keep an eye on what the Federal Reserve is doing with the interest rates that they can control directly, the interest rates that the Federal Reserve cannot control, and where the interest rates on different types of asset classes are relative to one another. In addition, it is very important to monitor where various interest rates are relative to inflation in order to have a more complete picture of what the risk profile looks like. The current picture for the next several months makes it look unlikely that interest rates will continue to rise like they have over the past few months. However, what we have seen so far this year has given us a taste of what to expect in the future when rates move back to more normal levels relative to inflation.
Michael Ball
Lead Portfolio Manager
Disclosure: Opinions expressed are not meant to provide legal, tax, or other professional advice or recommendations. All information has been prepared solely for informational purposes, and is not an offer to buy or sell, or a solicitation of an offer to buy or sell, any securities or instrument or to participate in any particular trading strategy. Investing involves risk, including the possible loss of principal. All opinions and views constitute our judgment as of the date of writing and are subject to change at any time without notice. Investors should consider the investment objectives, risks, charges and expenses of the underlying funds that make up the model portfolios carefully before investing. The ADV Part II document should be read carefully before investing. Please contact a licensed advisor working with Weatherstone to obtain a current copy. Weatherstone Capital Management is an SEC Registered Investment Advisor with the U.S. Securities and Exchange Commission (SEC) under the Investment Advisers Act of 1940. Weatherstone Capital Management is not affiliated with any broker/dealer, and works with several broker/dealers to distribute its products and services. Past performance does not guarantee future results.


