October 26, 2018Special Market Update
The Current Decline, Market Outlook, and the Weatherstone Investment Strategy
October has turned into a volatile month, as concerns over rising interest rates caused a rapid 5% drop in stocks over a two-day period earlier in the month, followed by a brief rebound over a few days, which then lead to generally sideways activity. However, stocks have begun to drop again over the past several days, even while the interest rates that investors were concerned about two weeks ago have started to decline. Concerns have now shifted to whether technology shares have become overvalued, if the recent tax cuts have yielded the earnings growth investors have anticipated, and how trade wars and tariffs will impact a potentially larger set of companies than originally expected.
The recent October declines have caused the major U.S. stock market indexes to turn negative for the year, which raises the question of whether this is a passing correction or the beginning of something bigger. To answer this, we must examine both the positive and negative factors that may contribute to the future direction of the stock market, and how our investment process can address both the positive and negative.
Positive Factors:
The U.S. Economy is Growing
Deeper and longer-lasting stock market declines typically occur when an economy is faced with a recession, and currently, there are no significant signs that the U.S. is likely to enter a recession in the next few months. Data from Ned Davis Research Group compares the differences in stock market declines that have experienced recessions, versus those that have not been pulled into a recession, dating back to 1900:
| Decline | # of Days | |
| Bear Markets with Recession | -35.9% | 517 |
| Bear Markets Without Recession | -23.3% | 224 |
This data indicates that while a bear market is still a possibility, if one were to occur, it would tend to be shorter and less severe than if there was a high probability of a recession.
Strength Following Midterm Elections
While this is a topic that was covered in our Q3 2018 investment commentary, we still believe it to be of strict importance (please contact the office or visit our website for a copy). Here is a recap of the pertinent information:
The month before the midterm elections, and the six months following the elections have historically been positive for stocks. The U.S. stock market performance during midterm election years from 1950 – 2014 is as follows:
| S&P 500 Performance (avg.) | Profitable Cases (#) | |
| October and Post-Election (October – April) | 19.39% | 94% |
In completing further analysis to determine any potential impact on market performance from the results of the midterm elections, we have found that while it does make some difference as to whether control of Congress changes, and if pre-election market performance was positive or negative, the tendency for a strong stock market rally still remains. Market gains tend to be stronger if there is weakness before the midterm elections, and if control of congress does not change, as seen below:
| Congressional Change of Control | Post-Election S&P 500 |
| Control Remains Unchanged | +22.46% |
| Control Changes | +13.76% |
| Performance leading up to mid-term elections | Post-Election S&P 500 |
| Positive U.S. stock market returns, (April-September) | +14.99% |
| Negative U.S. stock market returns, (April-September) | +24.35% |
The fact is, regardless of the outcome of the elections, performance of the U.S. stock market tends to be quite strong shortly before, and in the months following the mid-term elections.
History would tell us to expect strong gains between now and May of next year, but how does one reconcile this with the weakness the U.S. stock market has been experiencing throughout October? Looking back over the 12 previous midterm elections since 1970, we can compare the maximum decline during the September – April midterm cycle, and the total return over that time frame:
| Midterm Election Year | Maximum Drawdown (S&P 500) | S&P 500 Return 9/30 – 4/30 |
| 1970 | -4.72% | 23.44% |
| 1974 | -13.56% | 37.39% |
| 1978 | -12.24% | -0.76% |
| 1982 | -7.05% | 36.50% |
| 1986 | -7.55% | 24.66% |
| 1990 | -6.11% | 22.64% |
| 1994 | -5.98% | 11.24% |
| 1998 | -10.00% | 31.28% |
| 2002 | -14.05% | 12.27% |
| 2006 | -5.86% | 10.97% |
| 2010 | -6.41% | 19.49% |
| 2014 | -7.40% | 5.74% |
| 2018 | -8.85% (thru 10/24/18) | ? |
The extent of the decline the U.S. stock market has seen thus far is in line with prior midterm election years, and those midterm election years that occurred while the U.S. was experiencing a recession, high interest rates, war, and financial crises. I feel that where the U.S. is in relation to the historical profiles suggests that the history of prior midterm election years should be a good measure for the coming months.
Elevated Levels of Investor Pessimism
Investor pessimism (sentiment), is a contrarian factor we closely monitor, which has proved useful in identifying time periods in which a significant number of market participants have become pessimistic regarding the outlook for stocks. When this occurs, cash levels begin to increase, and as negative news is not realized, that cash begins to go back into the market, which can provide some above-average returns for a short period of time. This tends to work well even during bear markets, but is usually only useful over a 4-8-week timeframe. Below is a comparison of this sentiment indicator as of October 24th, 2018, relative to how the S&P 500 has performed since 1996, when this indicator reached a similar level of pessimism:
| Average Return | 5 Days | 10 Days | 15 Days | 20 Days | 25 Days | 50 Days |
| S&P 500 Index | 0.79% | 1.28% | 2.00% | 2.38% | 2.70% | 4.01% |
| Probability of Gain | 60% | 69% | 73% | 76% | 75% | 73% |
Corporate Stock Buybacks
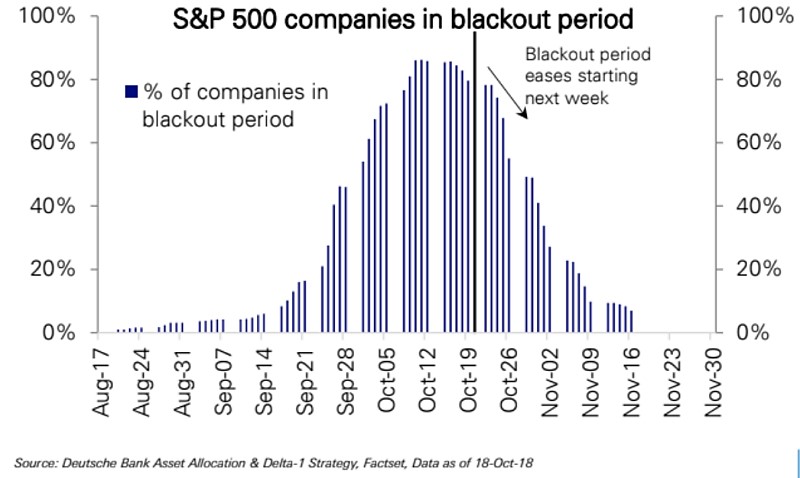
According to S&P Compustat, the amount of money spent by companies on stock buybacks over the past 12 months has been a record-setting $560 billion. Record-setting due in large part to the recent tax reform and lowered costs for companies to bring money back into the United States from overseas (repatriation). Companies mandate blackout periods around the time their corporate earnings are announced, which prevents a stock buyback. However, with earnings season beginning to wind down, we may see more and more companies restart their stock buyback programs over the coming weeks, as shown by the chart below:
These four factors provide support for our thesis that performance of the U.S. stock market should be positive over the coming months, but we must also address the potentially negative factors that could influence market performance in the coming months.
Negative Factors:
Slowing Global Economic Growth
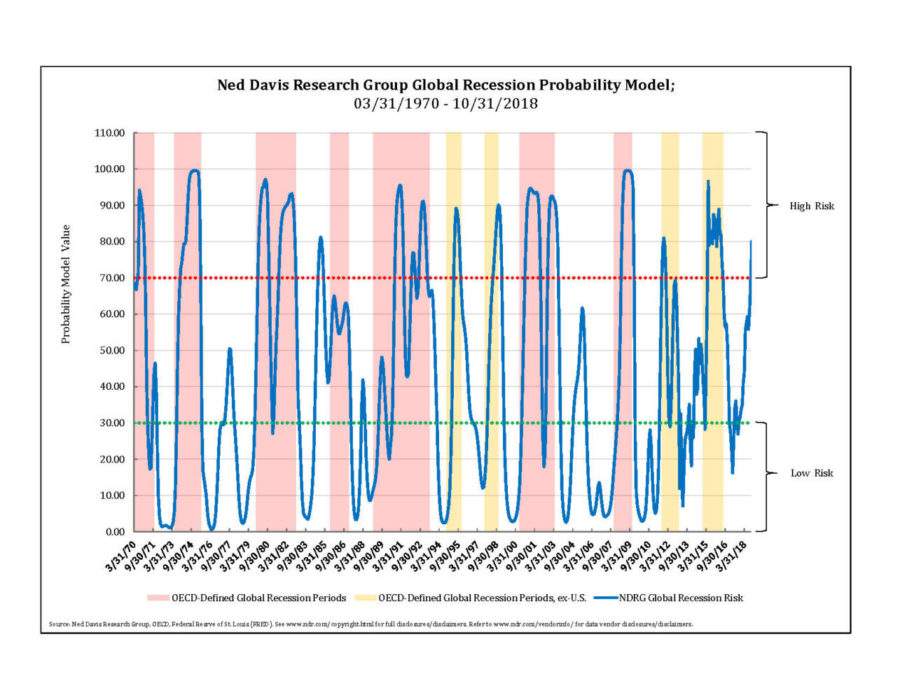
This is also something we covered in our most recent quarterly commentary, and certainly worth reviewing again. One important factor that may minimize the impact of the traditional post-election rally is the increasing amount of foreign economic weakness that is beginning to reveal itself. One model that we analyze for this utilizes Leading Economic Indicator data from 35 countries around the world, and then measures how strong or weak that data is. The chart below illustrates the model, showing zones for both high recession risk (above 70), moderate risk (30-70), and low risk (below 30). The shaded areas are periods defined as global recession, and as you can see, the model has been useful in identifying periods of global economic weakness.
Weakness in Foreign Stocks
Whether it is due to slowing economic growth or trade wars, foreign stock markets have had a challenging year, so far. The performance of most foreign stock markets followed fairly closely to the U.S. stock market, up until May, but has trended lower since. Currently, 40 of the 47 global markets are negative by 10% or more from their one-year highs, and 18 of those 47 markets are negative by 20% or more. Market advances tend to be longer lasting and stronger when both foreign and domestic markets are moving in the same direction. Quite simply, foreign stock market weakness has not been doing the U.S. stock market any favors.
Rising Interest Rates and Budget Deficits
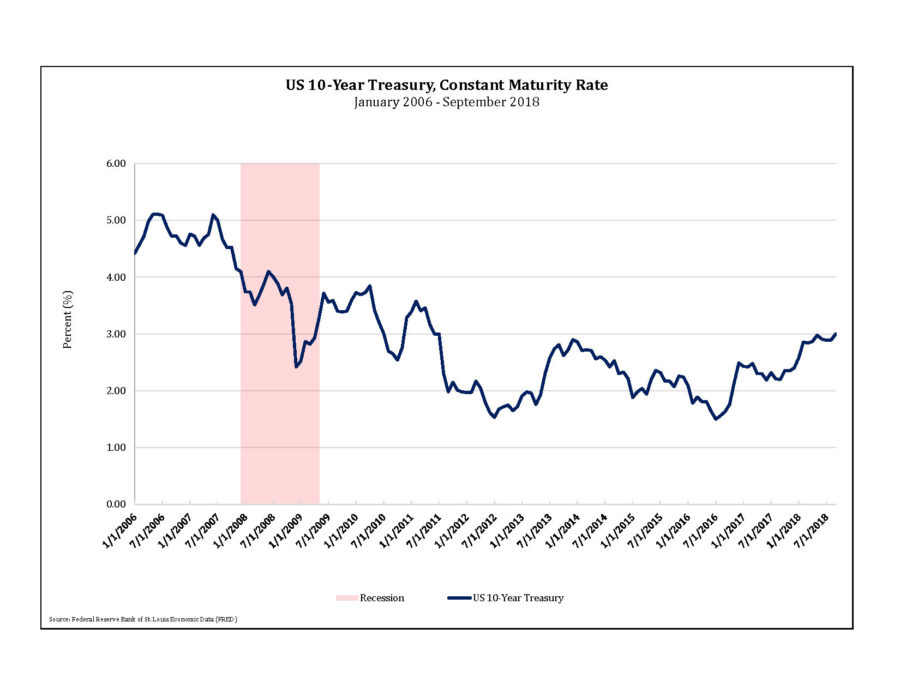
A second factor that might impede a post-election rally, is the rise of intermediate and longer-term interest rates moving to multi-year highs, and the likelihood of this continuing due to the large amounts of refinancing and new debt. The chart below illustrates the yield of 10-year government bonds from January 2006 September 2018. Bond yields came declined following the Global Financial Crisis of 2007-2008, and have bounced between 1.5% and 3.0% for more than five years. Earlier this month, the yield on 10-year government bonds moved to its highest level since 2011, and there is a significant upcoming supply of bonds to be issued that could continue to put upward pressure on yields going forward.While the most recent tax reform act did help to improve the corporate tax code, making companies more competitive with the rest of the world, it did raise the budget deficit. The U.S. government is now expected to borrow more than $1 trillion dollars to fund the deficit next year, up significantly from the nearly $550 billion that it needed to borrow in 2017.
In addition, the government will need to refinance $4.3 trillion of government debt over the next 12 months, which is approximately $500 billion more than the prior year. And finally, the Federal Reserve Bank is working to shrink the amount of loans on its balance sheet, which are a result of the purchases it made in the years following the Great Recession. Without the almost $30 billion of maturing bonds the Federal Reserve is not rolling over each month, this means that other investors will now need to step up to buy those bonds. The supply/demand imbalance will likely require an increase in interest rates in order to entice enough investors to want to sell other investments in order to buy bonds, which will become an increasing headwind for stocks.
Looking at how this has been impacting the financial markets, the U.S. stock market has been able to recoup the losses from its correction in January and early February, and then return to a new high in September. But the U.S. stock market was the only global market to reach a new high in September. Most major foreign stock markets have been showing increasing weakness since May, with both developed and emerging markets plummeting to new lows for the year in October.
Concerns Over Earnings
Corporate profits have had a boost in the past few quarters due to the corporate tax overhaul, and as we approach the one-year mark of the tax reform act, we will most likely come back down to more normal levels of year-over-year growth. According to a recent report from FactSet Research, “With earnings reports that have been coming out for the third quarter we have seen more companies beating estimates, but by a lower margin than average, and then we are seeing the market punishing both positive and negative earnings surprises more than average.” FactSet also noted, “Companies that have reported positive earnings surprises for Q3 2018 have seen an average price decrease of -.5% two days before the earnings release through two days after the earnings. This percentage decrease is well below the 5-year average price increase of 1.0% during this same window for companies reporting upside earnings surprises.”
Regarding negative earnings surprises, FactSet reports, “Companies that have reported negative earnings surprises for Q3 2018 have seen an average price decrease of -3.5% two days before the earnings release through two days after the earnings. This percentage decrease is larger than the 5-year average price decrease of -2.5% during this same window for companies with downside earnings surprises.”
It appears it is becoming harder and harder to impress investors with positive earnings, given recent stock performance behavior. And with possible headwinds from trade wars and slowing global growth, it is likely to become increasingly difficult to meet future earnings estimates, further increasing the tendency for to decline more than usual, unless the earnings surprise is unusually large. This would most likely be a negative for stocks.
Global Trade Skirmishes
Headlines about trade issues with several of the U.S.’ major trading partners, and U.S. imposed tariffs on other countries are certainly top of mind, with many of these countries retaliating in turn by raising tariffs on U.S. products. Recent research by an analyst at J.P. Morgan estimates that the current retaliatory trade environment the U.S. is in could reduce global growth by 0.4%. A recent analysis by the World Bank estimates that, “A tariff escalation, coupled with a shock to investor confidence, could reduce global exports by up to 3% ($674 billion) and global income by up to 1.7% ($1.4 trillion) with losses across all regions.”
Source http://blogs.worldbank.org/trade/impacts-global-trade-and-income-current-trade-disputes and CNBC 7/2/18
Our Investment Strategy
The Weatherstone investment process calls for us to look at a variety of factors that help us measure opportunity and risk. Among the most prominent, we measure a number of variables that are tied to the financial markets: economic strength and weakness in the U.S. and around the world; stock market valuations; and historical profiles of similar time periods.
Based on our research and experience, we believe the U.S. has been in the later stages of a bull market. Over the past several months, there has been increasing evidence that foreign markets have entered the initial stages of a bear market decline, while the U.S. market has remained in the later stages of a bull market advance. This, combined with the historical tendency for stocks to perform poorly during the summer months of midterm election years, and deterioration in our short-term risk measurement models, kept us more defensive during the summer rally than we would have liked. With the market action we have experienced in October, I would now say that there is a 35% chance that the U.S. stock market has entered into the initial stages of a bear market, and as a result, we have increased cash levels across our investment strategies. It still appears that the most likely outcome is a resumption of a U.S. stock market advance, potentially to new highs in the months ahead, and then greater risk for a bear market as we head into the second half of 2019. However, if we continue to see increasing signs of a bear market in U.S. stocks, we will be positioning more defensively, and implementing more of our bear market strategies. This would include an increased use of bonds, more extensive use of some shorter-term trades buying into periods of market weakness and high investor pessimism, and then selling into short-term strength. But also, a higher use of sector specific mutual funds and ETFs that would allow us to focus on segments of the market that may not be impacted as extensively by a general stock market decline.
In Summary
The recent market volatility pick-up over the past few weeks increases the likelihood that we may be transitioning from a bull market to a bear market, but the evidence is still quite mixed. The uptick in volatility has caused us to increase cash and bond holdings across most of our investment strategies. If the U.S. does move into a bear market we expect to employ a significant amount of defensive positioning, balanced with trading some of the potential, periodic market rallies that normally occur during such declines. But also, we will look for opportunities in areas that may be oversold, which could be likely leaders during the next bull market. As always, these expectations are based upon the current information that we have available to us, and may change as new information becomes available, and we cannot guarantee future performance of the markets or Weatherstone strategies.
Michael Ball, CFP®
Lead Portfolio Manager
Sources and Disclosure:
Opinions expressed are not meant to provide legal, tax, or other professional advice or recommendations. All information has been prepared solely for informational purposes, and is not an offer to buy or sell, or a solicitation of an offer to buy or sell, any securities or instrument or to participate in any particular trading strategy. Investing involves risk, including the possible loss of principal. All opinions and views constitute our judgment as of the date of writing and are subject to change at any time without notice. The Dow Jones Industrial Average is a price-weighted average comprised of 30 significant stocks traded on the New York Stock Exchange and NASDAQ. The S&P 500 Index is an unmanaged market capitalization weighted price index composed of 500 widely held common stocks listed on the New York Stock Exchange, American Stock Exchange and Over-The-Counter market. Indexes are provided exclusively for comparison purposes only and to provide general information regarding financial markets and no investment can be made directly into an index. These indices or funds referenced in the article should not be used as a comparison of managed accounts or suitability of investor’s current investment strategies. If the reader has any question regarding suitability or applicability of any specific issue discussed above, he/she is encouraged to consult with their licensed investment professional. The value of the index varies with the aggregate value of the common equity of each of the 500 companies. The S&P 500 cannot be purchased directly by investors. This index represents asset types which are subject to risk, including loss of principal. Investors should consider the investment objectives, risks, charges and expenses of the underlying funds that make up the model portfolios carefully before investing. The ADV Part 2 document should be read carefully before investing. Please contact a licensed advisor working with Weatherstone to obtain a current copy. If the reader has any question regarding suitability or applicability of any specific issue discussed above, he/she is encouraged to consult with their licensed investment professional. Weatherstone Capital Management is an SEC Registered Investment Advisor with the U.S. Securities and Exchange Commission (SEC) under the Investment Advisers Act of 1940. Weatherstone Capital Management is not affiliated with any broker/dealer and works with several broker/dealers to distribute its products and services. Past performance does not guarantee future results.


