The Global Economy Continues to Weaken, and The Federal Reserve Gets Ready to Cut Interest Rates
As we hit the midpoint of the year, there has been no significant change in the two important trends building through most of the year:
- The global economy continues to slow
- Federal Reserve continues to position themselves to cut interest rates.
In this commentary we will look at the recent developments with these two trends by taking a historical look at initial interest rate cuts by the Federal Reserve, and the subsequent impact on the stock market, evaluating recession risk, and then discuss our outlook for the coming months.
The Economy
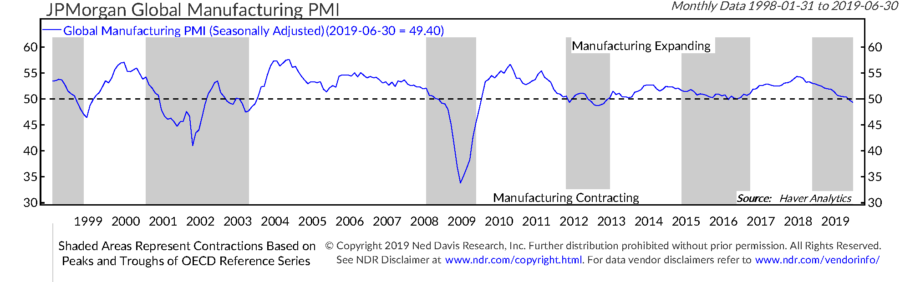
Looking first at the global economic picture, the stability that we were beginning to see a few months ago has given way to renewed weakness. The Global Manufacturing Purchasing Index (PMI) moved from growth to contraction when the June report was released and the index showed a reading of less than 50, and it has continued to deteriorate with the July reading. As can be seen in the chart below, this was the first time that the Global PMI Index has been in contraction since late in 2012, when there was a significant economic slowdown in Europe. The shaded areas in the chart represent global economic slowdowns and recession as defined by the Organization for Economic Development (OECD).
We have also seen a significant slowdown in corporate earnings over the past few quarters. The reported growth rate for operating earnings for the companies in the S&P 500 composite stock index has been slowing, but is still showing positive year over year growth, yet, according to the government’s GDP report, the most broad-based measure of corporate profits has begun to fall on a quarter-to-quarter basis. Here is the data from the past three quarters:
Q3 2018 $2.321 billion
Q4 2018 $2.311 billion
Q1 2019 $2.252 billion
Source: Ned Davis Research
The biggest factor that seems to be providing support for stock markets in the U.S. and around the world is the signaled willingness of the Federal Reserve and other Central Banks to cut interest rates or use other measures to lower interest rates. This can be good, because lowering interest rates can stimulate economic growth, and as interest rates are lowered, it can also help stocks look more attractive in comparison to government bonds.
If we go back and look at the history of the S&P 500 as a proxy for stock market performance after the initial interest rate cut by the Federal Reserve during the past 25 years, you will see that the subsequent performance of stocks is quite mixed, and that the bigger question investors should be asking themselves is whether the U.S. economy will enter a recession or not. Here are the four cases in which the Federal Reserve has made an initial cut in interest rates after a period of interest rate hikes in prior years.
- July 1995: No significant stock market decline in the subsequent two years from the point that the first rate-cut was made.
- Sept 1998: -8.53% was the largest decline in the months following the interest rate cut which occurred during the Asian Currency Crisis, as economic risks picked up and fears that the defaults on bonds by some emerging market countries could lead to a wider global financial crisis.
- January 2001: -42.35% was the maximum decline over the next couple of years from the point where interest rates were cut. The Federal Reserve was cutting interest rates in response to growing economic weakness in the U.S. and globally.
- Sept 2007: -55.48% was the maximum decline over the next couple of years from the point where interest rates were cut. The Federal reserve was cutting interest rates in response to continuing problems with sub-prime mortgages, a slowing housing market, and initial signs of economic weakness.
The biggest difference between the first two initial cuts in interest rates and the second two, is that the U.S. did not slip into a recession in the first two cases, but did in the second two cases. So, in determining whether an interest rate cut by the Federal Reserve will be beneficial for stocks in the coming quarters, we need to look at whether we are likely to experience a recession in the U.S.
One of the most accurate ways to measure the risk of a recession is to look at the work of Campbell Harvey, a Duke University finance professor, who back in the mid 1980’s did his PhD dissertation on yield curve inversions and recessions. He found that from the mid-1960’s through the early 1980’s, when either the 5 or the 10-year Treasury yield dropped below that of 90-day Treasury bills, and remain that way for at least a full quarter, a recession followed within 12-18 months. Since that time, his indicator has continued to work, and has correctly forecast upcoming recessions without a false signal. (See the chart below for reference).
While the fact that a 12-18 month lead time before a recession is very useful, it is also important to know how the U.S. stock market can behave before a recession. Since the end of WWII, the stock market has peaked about 7.5 months before a recession starts. With the new U.S. yield curve inversion first occurring on March 7th, we are now four months into the warning signal from an indicator that has a perfect record over the past 50 years of calling U.S. recessions. If history holds, then we would expect to see enough economic weakness to have a U.S. recession in 2020, and we are near the high-risk zone for stocks based off of this indicator.
Two important follow-up notes on the subject of recessions. It is true that global growth is slowing down, but primarily outside of the United States. Because almost everything that we see going on around us looks like the U.S. economy is quite robust, it does not feel like the U.S. is close to a recession. If we take a look back to 2005-2007, right before the 2007-2009 recession, we were frequently seeing headlines and statements in the financial press about how the world was “awash in liquidity” as there was a huge amount of money chasing mergers and large number of private equity transactions at the time, and much of it was financed with debt. When the first signs of financial stress begin to show up, that liquidity dried up very quickly, and the economy went from having lots of liquidity in 2007 to no liquidity in 2008. If we are looking solely at the anecdotal evidence that we see going on around us in the economy can sometimes give a false impression of where the underlying economy is heading.
Also, while the data shown above puts us on high alert for a recession, I would like to note that at least a moderate amount of economic weakness, and perhaps a significant amount of the weakness is coming from the trade war between the U.S. and China, and from the U.K. and the Eurozone over the Brexit process. We believe both of these issues are expected to be wrapped up in the coming months. This could be similar to the period of global economic weakness which we saw in 2011 and 2012 during the European Debt Crisis, when there was significant concern that Greece could default on its debts and that would have put many of the largest banks in Europe in danger of becoming insolvent. Action was taken by various governments and the European Central Bank to minimize the problem, and economic strength resumed. In much the same manner, actions taken by the U.S, China, the U.K, and Eurozone leaders might resolve the current situations and quickly reduce economic uncertainty, which should be beneficial for economic growth. In our opinion, this is a much more fixable set of problems than when we were entering the 2007-2009 recession and dealing with tough structural problems.
There are a number of other factors which could influence the market and could fill up several more pages, but the ones listed above continue to be the most significant. With the economic slowdown being a headwind for the stock market, and the expected easing of interest rates and support from Central Banks being a tail wind for the stock market, the outcome of the trade war between the U.S. and China, and the ability of Brexit to occur without significant economic disruption are all wild cards.
If things go well, this current slowdown could end up being very similar to what we experienced through most of 2015 and into mid-2016 when we had a temporary global economic slowdown and a very choppy stock market with above-average volatility. In that case, we were able to avoid a U.S. recession, which kept the stock market declines relatively modest. We currently have many similarities to 2015-2016 environment, but are beginning to see some signs implying greater economic problems as noted by the economic weakness spreading across a broader swath of countries than those directly involved in trade disputes, and the high number of yield curve inversions around the world. This backdrop has us positioned and prepared for a recession, but we hope that the actions of the various governments in trade negotiations over the coming months will reduce economic uncertainty and put us back on a much better foundation to sustain a stock market advance.
Michael Ball, CFP® Managing Director
Opinions expressed are not meant to provide legal, tax, or other professional advice or recommendations. All information has been prepared solely for informational purposes, and is not an offer to buy or sell, or a solicitation of an offer to buy or sell, any securities or instrument or to participate in any particular trading strategy. Investing involves risk, including the possible loss of principal. All opinions and views constitute our judgment as of the date of writing and are subject to change at any time without notice. The S&P 500 Index is an unmanaged market capitalization weighted price index composed of 500 widely held common stocks listed on the New York Stock Exchange, American Stock Exchange and Over-The-Counter market. Indexes are provided exclusively for comparison purposes only and to provide general information regarding financial markets. These indices or funds referenced in the article should not be used as a comparison of managed accounts or suitability of investor’s current investment strategies. The value of the index varies with the aggregate value of the common equity of each of the 500 companies. This index represents asset types which are subject to risk, including loss of principal. Investors should consider the investment objectives, risks, charges and expenses of the underlying funds that make up the model portfolios carefully before investing. Our regulatory brochure, ADV Part 2 should be read carefully before investing. Please contact a licensed advisor working with Weatherstone to obtain a current copy. If the reader has any question regarding suitability or applicability of any specific issue discussed above, he/she is encouraged to consult with their licensed investment professional. Weatherstone Capital Management is an Registered Investment Advisor with the U.S. Securities and Exchange Commission (SEC) under the Investment Advisers Act of 1940. Weatherstone Capital Management is not affiliated with any broker/dealer and works with several broker/dealers to distribute its products and services. Past performance does not guarantee future results.


