August turned in the weakest monthly performance for the stock market since 2012, with the S&P 500 declining by 6.03%, and the Dow Industrials declining by 6.57%(1). Interestingly, there seemed to be no major news event that can easily be identified as the reason for the drop. Many have looked to China and weakening global economic growth, but each of these issues have been evident since mid to late spring. Instead, it was a combination of factors that have been building over time that suddenly began to matter to market participants.
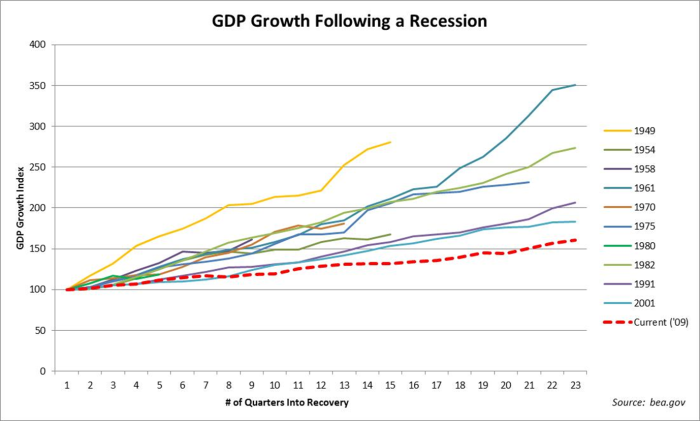
For the past few years we have discussed our concern about a significantly overvalued stock market, with the Shiller CAPE price/earnings ratio being in the top 10% most expensive readings in its more than 125 years of data, and that there was more danger than normal because the economic recovery was the weakest since the end of WWII.
Over the past several months we have become further concerned due to the slowdown of international economic growth as well as little or no gain in corporate earnings and a moderate increase in longer-term interest rates. These factors add to the difficulty of maintaining lofty valuations in stock markets especially with the renewed economic uncertainty and high market volatility in China. We recently discussed these concerns in prior monthly commentaries as well as in recent interviews with the Denver post and CNBC (click links). These concerns were enough to spark strong selling both domestically and globally causing U.S. stocks to drop by over 12% from their highs, and many global markets to experience larger declines.
The question on many people’s minds is whether this correction is nearly over or if this is the first leg down in a more significant decline. Looking at history there is some good and bad news, the bad news is that the correction did little to relieve the overvalued condition of the market, and when momentum is broken, such as it has been over the past few weeks, it puts the market in a very vulnerable position with potential for further significant declines. We experienced a similar situation during October of last year, when concerns about the Eurozone’s potential for recession and the possibility of a deflationary environment increased. However, markets were able to rebound as approval of a quantitative easing program designed to stimulate the economy became increasing likely to be approved. This time around, there are more negative factors facing the market and removing the primary concern (increasing global growth) will not be as easy, so risk is undoubtedly higher than it was last fall.
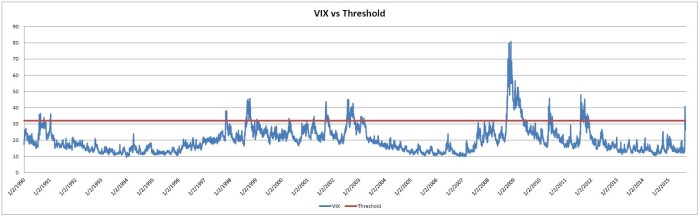
One of the indicators that the market is likely to have more downside risk is a study based on the performance of markets after volatility spikes higher. The chart below shows the CBOE Volatility Index, which is used as to gauge volatility within financial markets, commonly known as VIX going back to 1990. The dark red line on the bottom clip of the chart indicates the level at which we would consider a spike in the VIX to be important. Since 1990, when we have had the VIX index move above a reading of 32, it tended to be a warning of larger declines to come, with an additional median decline of -11.65% during the next 12 months.
The good news in our evaluation of the current environment is that the risk for a recession in the U.S. still appears to be quite low, and market declines around the start of, or during a recession are the most severe, so the current decline will hopefully be something along the lines of 1998, or 2011, and not 1987. While a 1998 or 2011 scenario appears to be the most likely outcome, which would suggest that the decline in stocks would probably not extend much beyond the 20% range there is one significant difference between the environment that we have today and the 1998 and 2011 declines. That is the trend in short-term interest rates. In 1998 the Federal Reserve cut rates three times to stimulate the economy, and in 2011 they announced a $400 Billion dollar debt-buying program designed to lower rates, and both of these moves helped stabilize the stock market. Today we have interest rates near zero and the Federal Reserve planning to begin increasing short-term interest rates now that unemployment rates are close to historically normal levels. The interest rate environment will be a headwind for the markets that we did not have during the 1998 and 2011 declines.
As we look at our current portfolio positioning, we have increased cash significantly in most of our equity strategies over the past few months, and we expect that volatility will remain above-average and the primary risks are to the downside based upon the current readings from our risk measurement models. Bonds have also been under pressure this year as concern about the magnitude of interest rate increases by the Federal Reserve have caused some investors to move away from these asset classes on concerns that the increase in interest rates may be larger than anticipated. We feel that many of these fears are overdone because when we look at the interest rate environment on a global scale, there are far more countries cutting interest rates than increasing rates, and both the global economic picture and inflation levels have been weakening in recent months rather than strengthening. As a result, we believe that the upward pressure on most intermediate and long-term interest rates will be modest until global economic growth and inflation begin to increase.
When we look at investment opportunities available in the current environment, we continue to like healthcare due to its relative stability of revenue and earnings growth in comparison to other major sectors. One area that is very appealing is the energy infrastructure segment of the energy sector. The energy infrastructure or MLP segment of the market typically owns pipelines and storage facilities for oil and natural gas and although the economics for these companies are quite different from exploration and production companies (E&P) such as an Exxon, the stocks of infrastructure companies have declined nearly as far as the E&P companies. With the energy companies already having undergone a severe bear market, there are some good opportunities from both a yield and valuation standpoint. We have initiated positions in energy infrastructure investment funds in some of our portfolios, and anticipate adding more as energy prices settle down and begin to move higher. We also find preferred stocks to be quite attractive as we see continued strength in the financial services companies and attractive yields on the preferred stocks that are near the 6% range.
In summary, we may be in the midst of a correction similar to 1998 or 2011, or possibly the early stages of a new bear market such as 2000 or 2007, the determining factor will likely be if investors continue to move away from stocks because of concerns over the economy, earnings, and interest rates, or whether concerns over these areas settle down enough that investors are willing to go back to buying stocks at premium prices because of a lack of compelling alternatives. Only time will tell, but we are positioned defensively until conditions begin to improve.
Michael Ball
Lead Portfolio Manager
Sources & Disclosure:
1) S&P Dow Jones Indices
Opinions expressed are not meant to provide legal, tax, or other professional advice or recommendations. All information has been prepared solely for informational purposes, and is not an offer to buy or sell, or a solicitation of an offer to buy or sell, any securities or instrument or to participate in any particular trading strategy. Investing involves risk, including the possible loss of principal. All opinions and views constitute our judgment as of the date of writing and are subject to change at any time without notice. The S&P 500 Index is an unmanaged market capitalization weighted price index composed of 500 widely held common stocks listed on the New York Stock Exchange, American Stock Exchange and Over-The-Counter market. Indexes are provided exclusively for comparison purposes only and to provide general information regarding financial markets. These indices or funds referenced in the article should not be used as a comparison of managed accounts or suitability of investor’s current investment strategies. If the reader has any question regarding suitability or applicability of any specific issue discussed above, he/she is encouraged to consult with their licensed investment professional. The value of the index varies with the aggregate value of the common equity of each of the 500 companies. The S&P 500 cannot be purchased directly by investors. This index represents asset types which are subject to risk, including loss of principal. Investors should consider the investment objectives, risks, charges and expenses of the underlying funds that make up the model portfolios carefully before investing. The ADV Part 2 document should be read carefully before investing. Please contact a licensed advisor working with Weatherstone to obtain a current copy. If the reader has any question regarding suitability or applicability of any specific issue discussed above, he/she is encouraged to consult with their licensed investment professional. Weatherstone Capital Management is an SEC Registered Investment Advisor with the U.S. Securities and Exchange Commission (SEC) under the Investment Advisers Act of 1940. Weatherstone Capital Management is not affiliated with any broker/dealer, and works with several broker/dealers to distribute its products and services. Past performance does not guarantee future results.


