- The biggest challenge facing U.S. fiscal policy is not just cutting $1.2 trillion in the deficit, it’s the structure of our current fiscal policy
- Mandatory government spending has increased from 33% in 1962 to 61% in 2010
- Interest payments on U.S. government debt will exceed 10% of all government expenditures in 2014
The recent failure of the Super Committee to come to an agreement has brought our nation’s fiscal crisis front and center. A look into the categories that encompass the United States’ spending will show that the challenge is much more than cutting $1.2 trillion from the deficit. The origin of fiscal policy was to allow the government to monitor and influence a nation’s economy by adjusting its level of spending. The theory behind fiscal policy is that when the private sector slows and the economy contracts, the government is able to fill some of the void by increasing spending. In theory, the increased government spending should increase employment and drive growth by supplying additional demand where the private sector cannot. However, since fiscal policy took its place around the Great Depression, its role has strayed off track.
As shown in Chart 1 below, US government expenditures can be categorized into two broad categories, mandatory and discretionary expenditures. Discretionary spending can be ratcheted up to stimulate economic growth when the private sector is lacking and can be ratcheted down when the economy is running on its own. Spending on items such as defense, infrastructure (e.g. highways and bridges), and technology (e.g. NASA) all fall into the discretionary spending category. Mandatory spending is required by a law or contract and is required during both economic expansions and contractions. Spending on items such as Social Security, Medicare, and Medicaid all fall into the mandatory spending category.
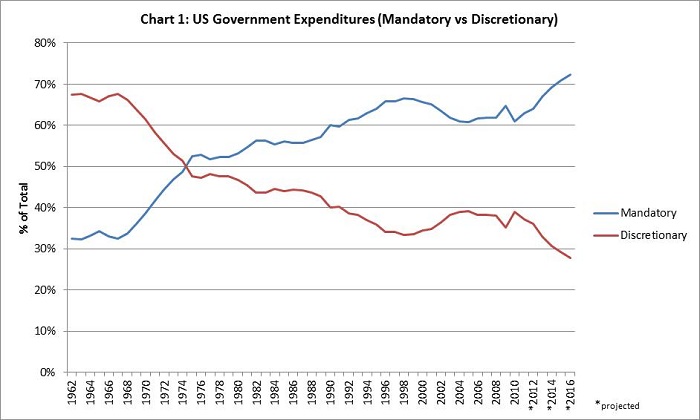
Source: Office of Management and Budget (2)
The Human Resources category is the major contributor to mandatory spending and the growth of this category, as shown in Chart 2 below. The sub-categories that encompass the Human Resources expenditures includes: Education, Social Services, Medicare, Medicaid, Unemployment Benefits, Veterans Benefits and Social Security. Within this category Medicare, Medicaid and Social Security accounted for 64% of total Human Resources outlays and is expected to reach 73% by 2016. Education accounted for only 5% of this category in 2010 and is projected to decline further to 3.8% by 2016. The average number of workers per Social Security beneficiary has fallen from 4.9 in 1960 to 2.8 in 2010 and is projected to fall even further to 1.9 in 2030. In addition, the number of retired workers is projected to rise from 54 million in 2010 to 91 million in 2035 (1). This implies that the Human Resources category will grow exponentially over the coming years, while the ratio of tax payers to beneficiary will decrease.
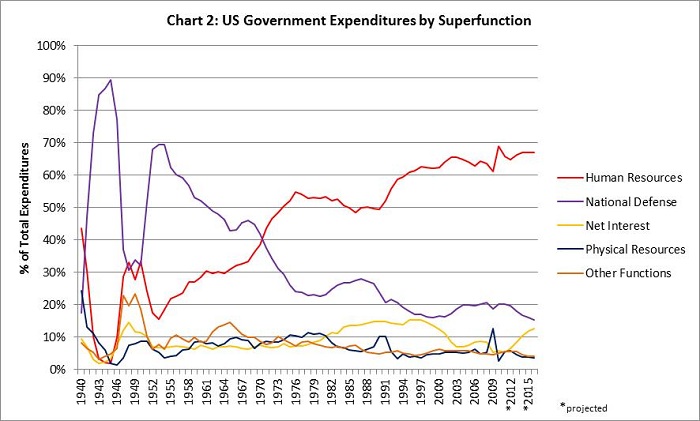
Source: Office of Management and Budget (2)
Referring back to Chart 2, you can see that as a percent of total government outlays, the Net Interest category exceeded 10% of total capital outlays during the periods of 1947 to 1951 and from 1981 to 2001. Everyone remembers interest rates increasing in the 1980’s, where the average mortgage rate rose above 15%. The average rate from 1980 to 1990 on the 30-year government bond was 10.56%, while recently this rate dropped to below 3%. This interest burden carried over through the 90’s as the US continued to make interest rate payments on the long-term debt issued during the 80’s.
The Net Interest category is again forecasted to exceed 10%, beginning in 2014 (2). Although we are currently issuing debt at record low rates, this more than likely will not continue. Increasing cause for concern comes from the recent downgrade of the US government’s bond rating by the credit rating agency, Standard and Poors and a “watch” status put in place by the other major agency, Moody’s. If large holders of US debt, like China and Japan, begin to demand higher interest rates, this could expedite the rise in cost to service this record amount of debt. Outlay categories, such as Net Interest, do not contribute to growth in Gross Domestic Product (GDP) since the expenditure goes directly to servicing the debt. Categories that are designed to contribute to GDP growth are categories such as Defense and Physical Resources. For example, a dollar spent towards defense, might be spent on building a new plane. This dollar supports numerous companies that contribute to the production of getting the plane in the air. From the company that provides the metal materials to build the shell of the plane, to the pilot that will get in the cockpit, these all contribute to growth in GDP.
Instead of having the option to ramp up spending during a stagnant or declining economy, we are pigeon holing ourselves into a corner where we are required to make payments to mandatory programs no matter what condition the economy is in. The challenge is, God forbid there will be another world war, the US will have a massive challenge of ramping up its National Defense spending to near World War II levels when mandatory spending is anywhere near its current level of total US Government Expenditures. There is also the possibility that the entire macro-economic framework could be undergoing a change as well.
On average, the length of a recession has been declining while the length of expansions has been increasing. From 1945 to 2009, the average length of each contraction has been 11 months and the average length of an expansion has been 59 months. From 1919 to 1945, and prior to fiscal policy, contractions averaged 18 months while expansions averaged 35 months in length (3). The ability to ramp up government spending during contractions has contributed to this evolvement in the length of each cycle. It is worthwhile to monitor the current and future fiscal policies of the US government as well as other international governments and their effects on growth. During times of contraction, countries unbounded by mandatory spending will be able to ramp up discretionary spending. These countries and regions will be in a better position to rebound faster when coming out of a regional or global recession.
Luke Nagell
Investment Committee Member
Weatherstone Capital Management
Sources (1) http://www.cbo.gov/doc.cfm?index=12376 (2) http://www.whitehouse.gov/omb/budget/Historicals (3) http://www.nber.org/cycles.html
Disclosure Information provided comes from independent sources believed reliable, but accuracy is not guaranteed and has not been independently verified. The opinions expressed are those of the portfolio management at Weatherstone Capital Management and not to be construed as investment advice or offer to buy/sell a security, or a solicitation which should only be provided by a qualified financial advisor prior to entering into any investment that involves risk. Investment decisions should be made based on investor’s specific financial needs, objectives, goals and time horizon. All opinions and views constitute our judgment as of the date of writing and are subject to change at any time without notice. Past performance does not guarantee future results.


