The Danger of the 10th Decile
One of the most important questions we should be asking ourselves as investors is, “How much should I expect to make on my investments over time?” We will be basing very important decisions on the answer to this major question, such as “When will I retire?” and “How much can I spend from my investments during retirement?” Needless to say, we will need to be very careful on how we come up with the answer. While it is tempting to go with the historical average rate of return, or to base expectations off of recent experience, the implications of missing our projected rate of return can be very detrimental.
Back in the mid to late 1990’s I started to see a disconcerting trend among many retirees and people getting ready to retire. They were looking at their investment gains over the past decade or so and assuming that these gains would be sustainable. It was becoming routine to hear people talking about taking a 10-12% withdrawal rate from their mutual funds. The assumption was that this should be fine because they had been going up an average of 14-18% per year, and that should support the withdrawal and provide a cushion in the event of a down year. While that strategy would have worked during the great bull market that we saw from the early 1980’s until 2000, it would not have worked in almost any other decade. As a result I researched and wrote an article that was published in Financial Planning Magazine in 1997 that looked at what withdrawal rates were safe, and which ones were dangerous over a much longer period of history, going back all the way to 1926. The conclusion was that in the broader context of history, 10% withdrawal rates were a short-term anomaly, and that levels less than half that were more prudent. In addition, I found further support for using risk management to minimize volatility was very important to maintaining a sustainable withdrawal rate.
It is time to revisit this topic because we have moved back to a situation where we once again face significant risks to what most people expect to be sustainable withdrawal rates. Investor confidence appears to be misplaced, with a more than 80% of workers expecting that their retirement account returns will continue to meet or exceed the returns of the past, according to a recent survey by Blackrock.
In past newsletters we have frequently discussed valuation, and the reason why we’ve done this is because it is an excellent predictor of long-term stock market returns. When it comes to bonds, the single best predictor of returns in the current interest rate level. For example, if you buy a 10 year government bond, the current yield say, of 2.4%, will determine 98% of your future return if you hold that investment until its maturity. The interest rate at which you reinvest the interest payments you receive will determine the other 2% of your total return over 10 years.
For stocks, people often look at the price/earnings ratio, typically referred to as the P/E ratio as the measure of whether stocks are cheap or expensive. While there are a number of different ways to calculate them by looking at current earnings, expected future year earnings, etc., the measure which has the best correlation to accurately predicting future returns is the cyclically adjusted price earnings ratio (CAPE) which was popularized by Robert Shiller of Yale University, and for which he was a Nobel Prize in Economics back in 2013. The data on this ratio goes back all the way to 1881, and based upon that data we have been in an overvalued state since 2013, obviously concerns about the overvaluation are nothing new, so what has changed? We have recently moved into the highest 10% of historical valuations when looking back at both the time frame from 1900 to current, as well as from 1945 to current, and the data sounds a note of caution that will be prudent to pay attention to.
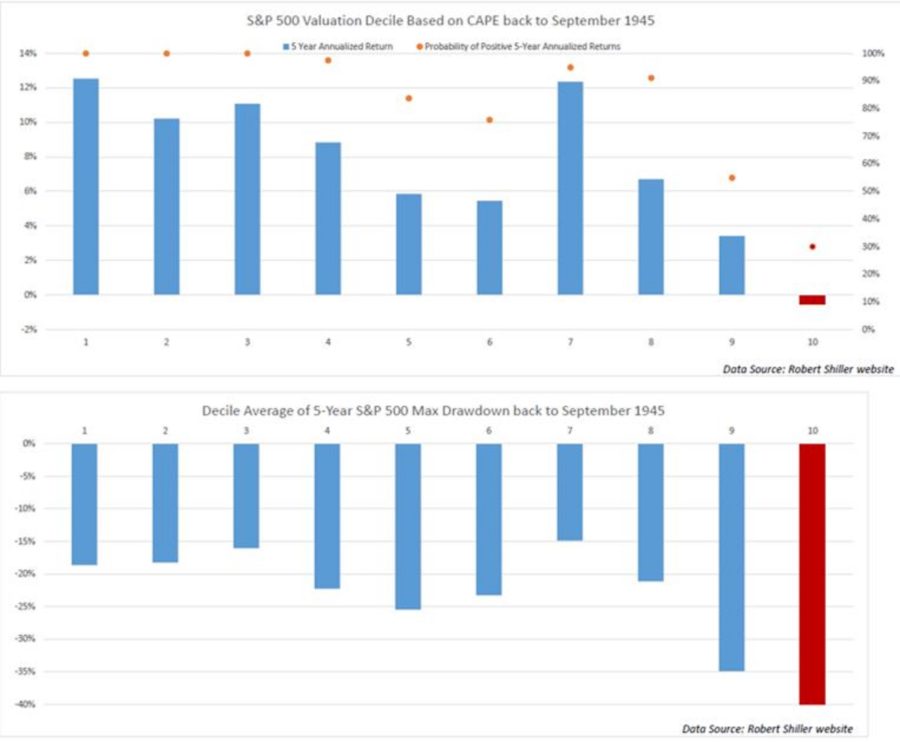
The chart shown below breaks down valuation by 10% increments, from the 10% cheapest in group one to the 10% most expensive in group 10. For the sake of simplicity we are going to just focus on the data from 1945 to current, although the results from 1900 to current are also very similar. Last fall we moved from the 9th decile, where we have been for quite some time, to the 10th decile. The implications of this become particularly important over the next five years based upon past experience.
(1)
Let’s talk about some of the data on the chart and what it means. The red dot in each decile is the probability that you will make money over the following five years from any starting point of time within that decile. So, when we were in decile nine, the probability of making money in the stock market based off of the performance of the S&P 500 Index was 55%. In decile 10 the probability of the index being higher five years later dropped to 30% historically. The next line is the expected annual return. Moving from decile nine to ten dropped the expected annual return from 3.42% to -.52%. (Please note that these returns are before the impact of dividends, so in this environment that will improve returns by about 2% per year). Finally, the bottom clip of the chart shows the average decline experienced during the following five years when someone buys stocks in that decile. The numbers are both well above average for deciles nine and 10, with the historical average for our current decile being -40%.
While these numbers paint a somewhat discouraging picture for the stock market over the next several years, there are some important points to note.
First, moving into the 10th decile does not always have a negative outcome. When we are looking at the historical profiles, we are looking at average outcomes. While the average return in decile ten is decidedly weak, there were some instances where you could make it through without a deep decline, and stocks in some cases did well for a few years before having the significant declines. What this does do is warn us that we need to be extra vigilant in our approach to markets and risks.
Also, it is worth noting, this analysis is looking specifically at U.S. stocks. Stock valuations around the world are generally cheaper than in the U.S. and it may be prudent to increase exposure to foreign markets. Some additional analysis we did going back over the past 25 years found that during periods when the U.S. was in the 10th decile, that foreign stocks did provide a higher average annual return of about 3% per year, but the average decline levels were similar.
So, how does this impact the day-to-day positioning of the investment strategies managed by Weatherstone in which we hold stocks? We find it useful in terms of letting us know that we are in an environment where the next significant decline is likely to be both deeper and longer than normal. It also means that the best returns from stocks may come from foreign markets, and by tactically managing the equity exposure between stocks and bonds in a more sideways moving market. Lastly, that bonds and alternative investments may in some cases provide similar expected returns with lower potential volatility.
The increasingly high stock market valuations have lead us to be more cautious in our positioning in stocks for many of our investment strategies in recent years, particularly during periods where we have seen signs of slowing domestic or global economic growth. However, we incorporated and increased the weighting of some short-term risk measurement models that are almost entirely based upon internal market factors across domestic and global stock markets and competing asset classes. With nearly four years of real-time experience and a couple of additional refinements, we have been very pleased with how these models have navigated the volatility in 2015-2016, and how they have participated well in the stock market rally over the past six months. This combination of models has given us a good balance of allowing us to benefit from short-term opportunities while navigating the later stages of the current bull market.
In summary, we are alert to the long-term challenges that high valuations pose for investors in achieving historically average rates of return. We are aware of the fact that despite the high valuation, that stocks could continue to move higher for a while, and we have a plan to both achieve some participation if stocks move to even high valuation levels, as well as to move asset allocations away from U.S. stocks to defensive or international investments if stocks follow a deep decline that has been typical of past episodes of high valuation. We feel that greater flexibility will be required for investors who desire to have investment returns that are similar to the historical averages and that being tactical should be one of the best paths to reach that goal.
Michael Ball
Lead Portfolio Manager
Sources and Disclosure:
- Robert Shiller Website
Opinions expressed are not meant to provide legal, tax, or other professional advice or recommendations. All information has been prepared solely for informational purposes, and is not an offer to buy or sell, or a solicitation of an offer to buy or sell, any securities or instrument or to participate in any particular trading strategy. Investing involves risk, including the possible loss of principal. All opinions and views constitute our judgment as of the date of writing and are subject to change at any time without notice. The Dow Jones Industrial Average is a price-weighted average comprised of 30 significant stocks traded on the New York Stock Exchange and NASDAQ. The S&P 500 Index is an unmanaged market capitalization weighted price index composed of 500 widely held common stocks listed on the New York Stock Exchange, American Stock Exchange and Over-The-Counter market. The Dow Jones Transportation Average is a price-weighted average of 20 transport stocks in the United States. The Dow Jones Utility Average is the price-weighted average of 15 utility stocks traded in the United States. The S&P MidCap 400 Index is comprised of companies across different sector that are between $750 Million and $3 Billion in market capitalization. The S&P SmallCap 600 covers a wide range of small cap stocks, market capitalization that range from $400 Million to $1.8 Billion, and is weighted according to market capitalization. The S&P 500 Energy Sector is comprised of companies included in the S&P 500 that are classified as members of the GICS® energy sector. The MSCI World Index Ex US is a free-float adjusted market capitalization weighted index designed to measure market performance of developed markets that exclude the United States. The MSCI Emerging Markets Index is a free float-adjusted market capitalization index designed to measure equity market performance of 23 emerging market countries. Indexes are provided exclusively for comparison purposes only and to provide general information regarding financial markets and no investment can be made directly into an index. These indices or funds referenced in the article should not be used as a comparison of managed accounts or suitability of investor’s current investment strategies. If the reader has any question regarding suitability or applicability of any specific issue discussed above, he/she is encouraged to consult with their licensed investment professional. The value of the index varies with the aggregate value of the common equity of each of the 500 companies. The S&P 500 cannot be purchased directly by investors. This index represents asset types which are subject to risk, including loss of principal. Investors should consider the investment objectives, risks, charges and expenses of the underlying funds that make up the model portfolios carefully before investing. The ADV Part 2 document should be read carefully before investing. Please contact a licensed advisor working with Weatherstone to obtain a current copy. If the reader has any question regarding suitability or applicability of any specific issue discussed above, he/she is encouraged to consult with their licensed investment professional. Weatherstone Capital Management is an SEC Registered Investment Advisor with the U.S. Securities and Exchange Commission (SEC) under the Investment Advisers Act of 1940. Weatherstone Capital Management is not affiliated with any broker/dealer, and works with several broker/dealers to distribute its products and services. Past performance does not guarantee future results. Weatherstone Capital Management
This letter is for information purposes only and does not require a response. IMPORTANT NOTICE REGARDING CLIENT PRIVACY
At Weatherstone Capital Management, Inc., maintaining the trust and confidence of our clients is a high priority. An important part of our relationship includes maintaining the confidentiality of our clients’ nonpublic personal information. Below is our policy regarding the collection and protection of your personal information.
Most importantly, we do not sell any of our clients’ personal information to anyone.
We have security processes, which include physical, electronic and procedural safeguards. These are designed to limit access to our clients’ information only to those employees and agents who may need it to adequately perform their job and provide services to the client. These employees and/or agents are required to respect the confidentiality of this information.
We collect information that is necessary to administer your account(s) with us. This information is collected and retained to help serve your financial needs, to provide customer service, and to fulfill legal and regulatory requirements. The information that we collect is as follows:
Identifying information furnished by you on custodial and other account establishment forms. Examples include your name, address, age, Social Security number and beneficiary designations.
Account transaction information obtained from you and the various entities that comprise the assets in your account(s). This includes balances, positions and history that have occurred within your account(s), along with correspondence and phone contacts with us concerning your account and the assets held within your account(s), and our services.
Identifying information and account transaction information may be disclosed to custodians, insurance companies, or other financial service providers, who are nonaffiliated parties, for the purpose of establishing, managing and maintaining financial services for your account(s). Examples are Broker/Dealers, Registered Investment Advisors, or Investment Advisory Representatives. These companies and individuals are also required to maintain the confidentiality of this information.
Other than the above exceptions, we do not disclose any nonpublic personal information regarding our current or former clients unless authorized by the client or as permitted by law.
In November of 1999, Congress enacted the Gramm-Leach-Bliley Act (“GLBA”). The GLBA requires certain financial institutions, including broker-dealers and investment advisers to protect the privacy customer information. To the extent of financial institution discloses customer information to nonaffiliated third parties other than as permitted or required by law. Customers must be given the opportunity and means to opt out (or prevent) such disclosure. Please note that we do not disclose customer information to nonaffiliated third parties except as permitted or required by law. (e.g. disclosures to service your account or to respond to subpoenas).
Part 2 of Form ADV: Weatherstone Capital Management Brochure
We would like to notify you of two changes to our fee policy:
We will plan to suspend refunds of advisory fee changes during the quarter. If an account moves from a higher fee model to a lower fee model, fees for the new model will commence at the beginning of the following quarter. For any questions regarding this change please contact Daniel Graff 720-287-3233.
We have reduced the fee for our Foundation Models. You have received an email regarding this change from 1.95% to 1.75%. If you have any questions regarding this change or would like additional information regard our Foundation models you can contact Ryan Connolly at 720-407-4311.
ADV OFFERING
Upon request, Weatherstone Capital Management will provide to you, at no cost, a copy of Part 2 of our most recent Form ADV on file with the SEC which describes the services offered through Weatherstone Capital Management and other important information.
Phone: (800) 690-5918
Email: support@weatherstonecm.com


